The EPA Lead and Copper Rule is an Optical Illusion
DC Water’s own data suggest widespread exposure to lead in tap water

The Duck-Rabbit Illusion (image source)
Down a rabbit hole: “Used to indicate passage into a strange, surreal, or nonsensical situation or environment.” “With allusion to ‘L. Carroll’ Alice's Adventures in Wonderland (1865), which describes how the protagonist, Alice, enters a land of magic and strange logic by falling down a rabbit hole.” Oxford English Dictionary
Under the regulation that is supposed to protect us from lead in water (the Lead and Copper Rule or LCR), Washington DC has excellent water quality. But upon examination, the water utility’s own data is alarming. Most homes the utility tested for LCR compliance purposes had lead-in-water contamination. Many more homes where DC residents sought testing independently also had lead flowing out of their taps, including concerning lead spikes. The degree of contamination currently present in Washington DC is acceptable under the LCR for not only the nation’s capital, but also for all communities across the US. In other words, the current LCR is an optical illusion like the picture above. From a regulatory perspective, a community’s water can meet all water quality standards and water utilities can declare it “safe.” From a public health perspective, however, the contamination can pose a clear and serious public health risk to residents who are left uninformed and unequipped to protect themselves from exposures.
It is often presumed that if the water were unsafe our water utilities would tell us. Under the LCR, water utilities do just the opposite.
On Friday, June 25, 2021, 20 years after our headline-making lead-in-water crisis, the Campaign for Lead Free Water has the honor to host EPA’s Washington, DC Community Roundtable on the Lead and Copper Rule Revisions (LCRR). EPA’s aim for the ten Community Roundtables it is convening this summer is to “foster dialogue on the experience of communities that are affected by lead in drinking water as the agency reviews the LCR to ensure that it supports EPA’s priorities.”
Using the District of Columbia and its water utility (DC Water) as an example, we intend to draw attention to what we see as an overarching flaw in the LCR. Namely that, for all intents and purposes, this regulation mandates water utilities to work at cross-purposes with the communities they are required to protect.
The LCR is not only a regulation. It is also a tool with which water utilities assess and paint a picture of the quality of their drinking water. When this picture is “good”—in other words, when water utilities meet regulatory requirements—the quality of the water is deemed acceptable for drinking and cooking. Sometimes, water utilities employ a “good” picture to make the explicit claim that their water is “safe.”
We are concerned that the picture water utilities paint for LCR compliance purposes and subsequent public messaging creates a type of optical illusion, like the image above. On the one hand, it is a picture of a single “image” that is based on a single set of data points. On the other hand, it can usually be perceived as two different images depending on the lens through which it is viewed. One lens is a regulatory lens. Another lens is a public health lens. An “image” that through a regulatory lens presents as “good” can quickly present as alarming when viewed through a public health lens. For this reason, we argue that the LCR serves as a form of “rabbit hole” that confuses, distorts, and ultimately leaves people in harm’s way just while it claims to protect them.
Washington, DC is a case in point of what is both a national and a systemic problem.
Below are two highlights:
Through a regulatory lens, DC’s water quality is remarkably “good”
In 2019, DC Water’s 90th-percentile lead value for the first semester was 2.2 parts per billion; for the second semester it was 2.3 parts per billion (see graphs 1 and 2 below; for regulatory compliance purposes, 90th-percentile values must be at or below the LCR’s Lead Action Level of 15 parts per billion).
In 2020, DC Water’s 90th-percentile lead value for the first semester was 1.8 parts per billion; for the second semester it was 2.8 parts per billion (for regulatory compliance purposes, 90th-percentile values must be at or below 15 parts per billion).
For both 2019 and 2020, DC Water’s Consumer Confidence Report (CCR) stated that DC’s water is “clean, safe, and healthy.”
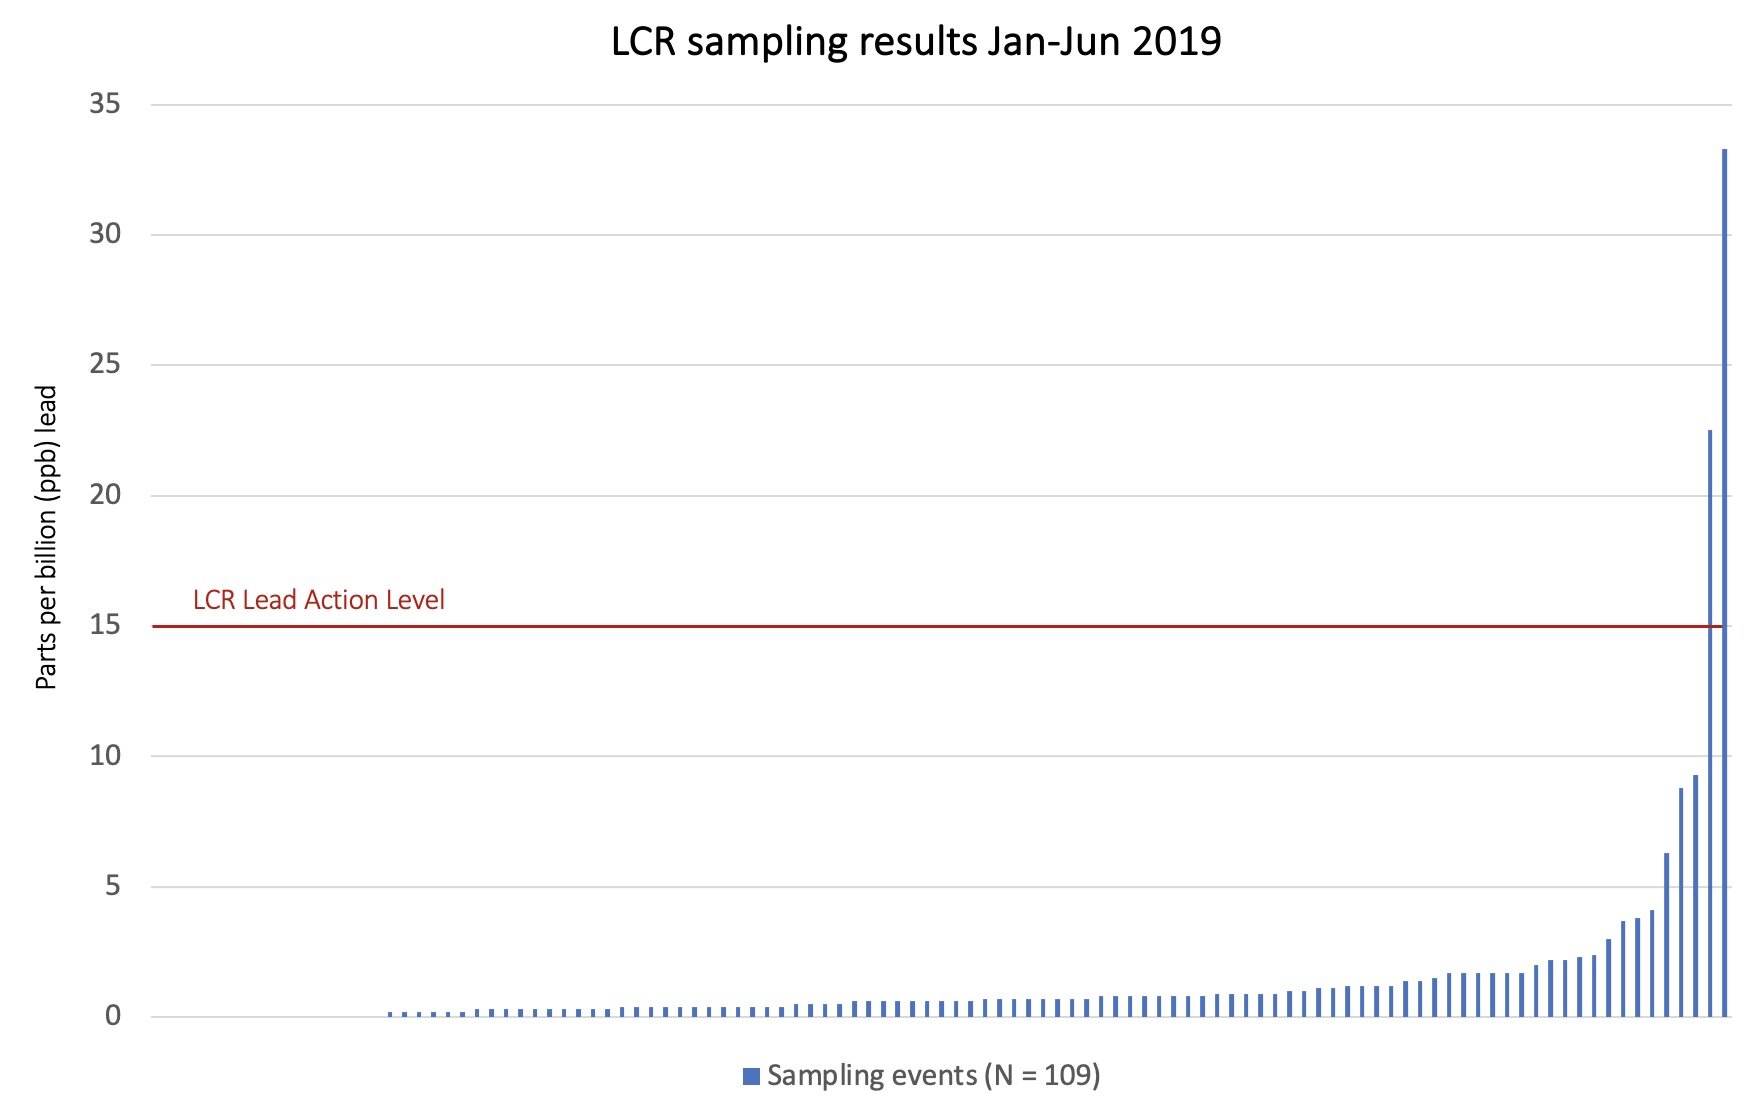
Graph 1: Under the LCR, remediation requirements are triggered when over 10% of taps exceed 15 parts per billion lead in the 1st-draw sample. In Jan-Jun 2019, DC Water sampled 109 taps. Only two (1.8%) measured above 15 parts per billion, placing DC Water in easy compliance with the LCR.
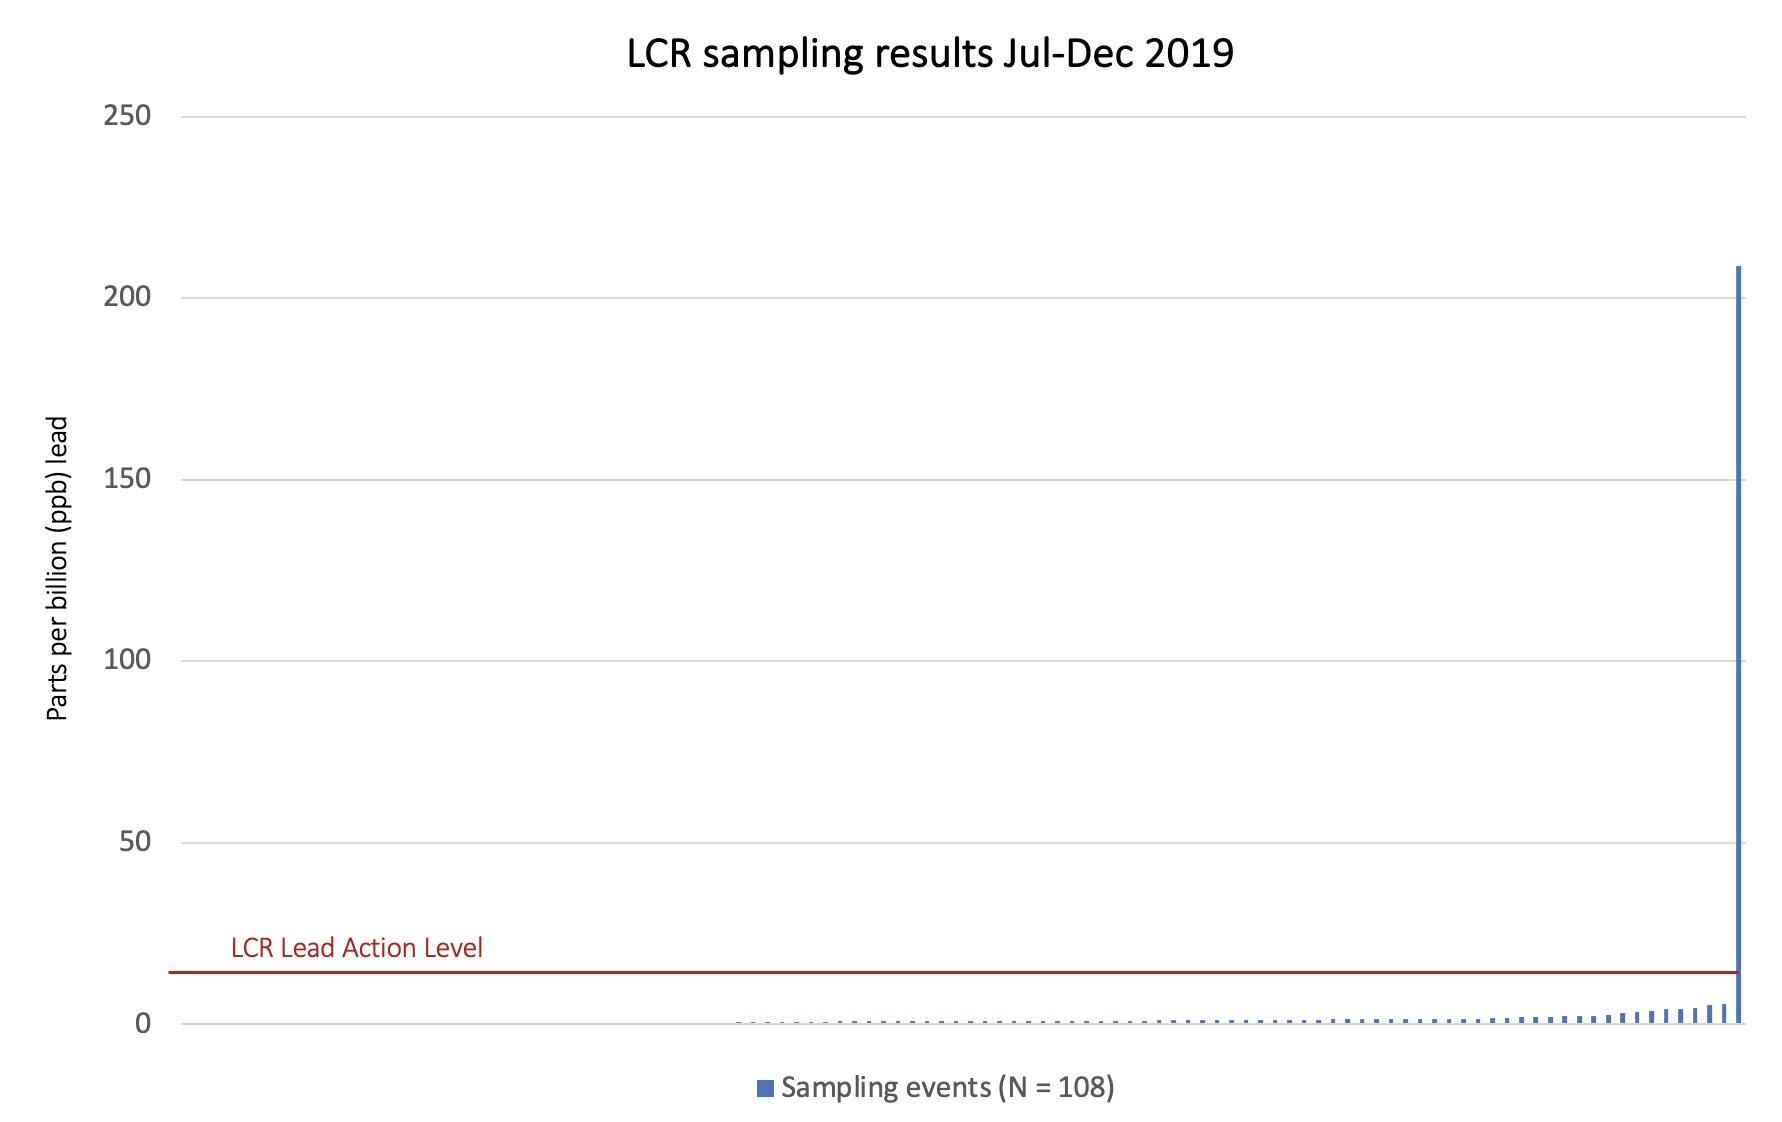
Graph 2: Under the LCR, remediation requirements are triggered when over 10% of taps exceed 15 parts per billion lead in the 1st-draw sample. In Jul-Dec 2019, DC Water sampled 108 taps. Only one (0.9%) measured above 15 parts per billion, placing DC Water in easy compliance with the LCR.
Through a public health lens, DC’s water quality depicts a different reality
In 2019, 88.5% of sampling events at high-risk homes showed detectable levels of lead in the first, second, or both samples drawn. 76% of sampling events showed detectable levels of lead in both samples. The highest 1st-draw lead value was 208.9 parts per billion. The highest 2nd-draw lead value was 24 parts per billion (see graph 3 below).
In 2020, 84.5% of sampling events at high-risk homes showed detectable levels of lead in the first, second, or both samples drawn. 76.4% of sampling events showed detectable levels of lead in both samples. The highest 1st-draw lead value was 37.3 parts per billion. The highest 2nd-draw lead value was 105.8 parts per billion.
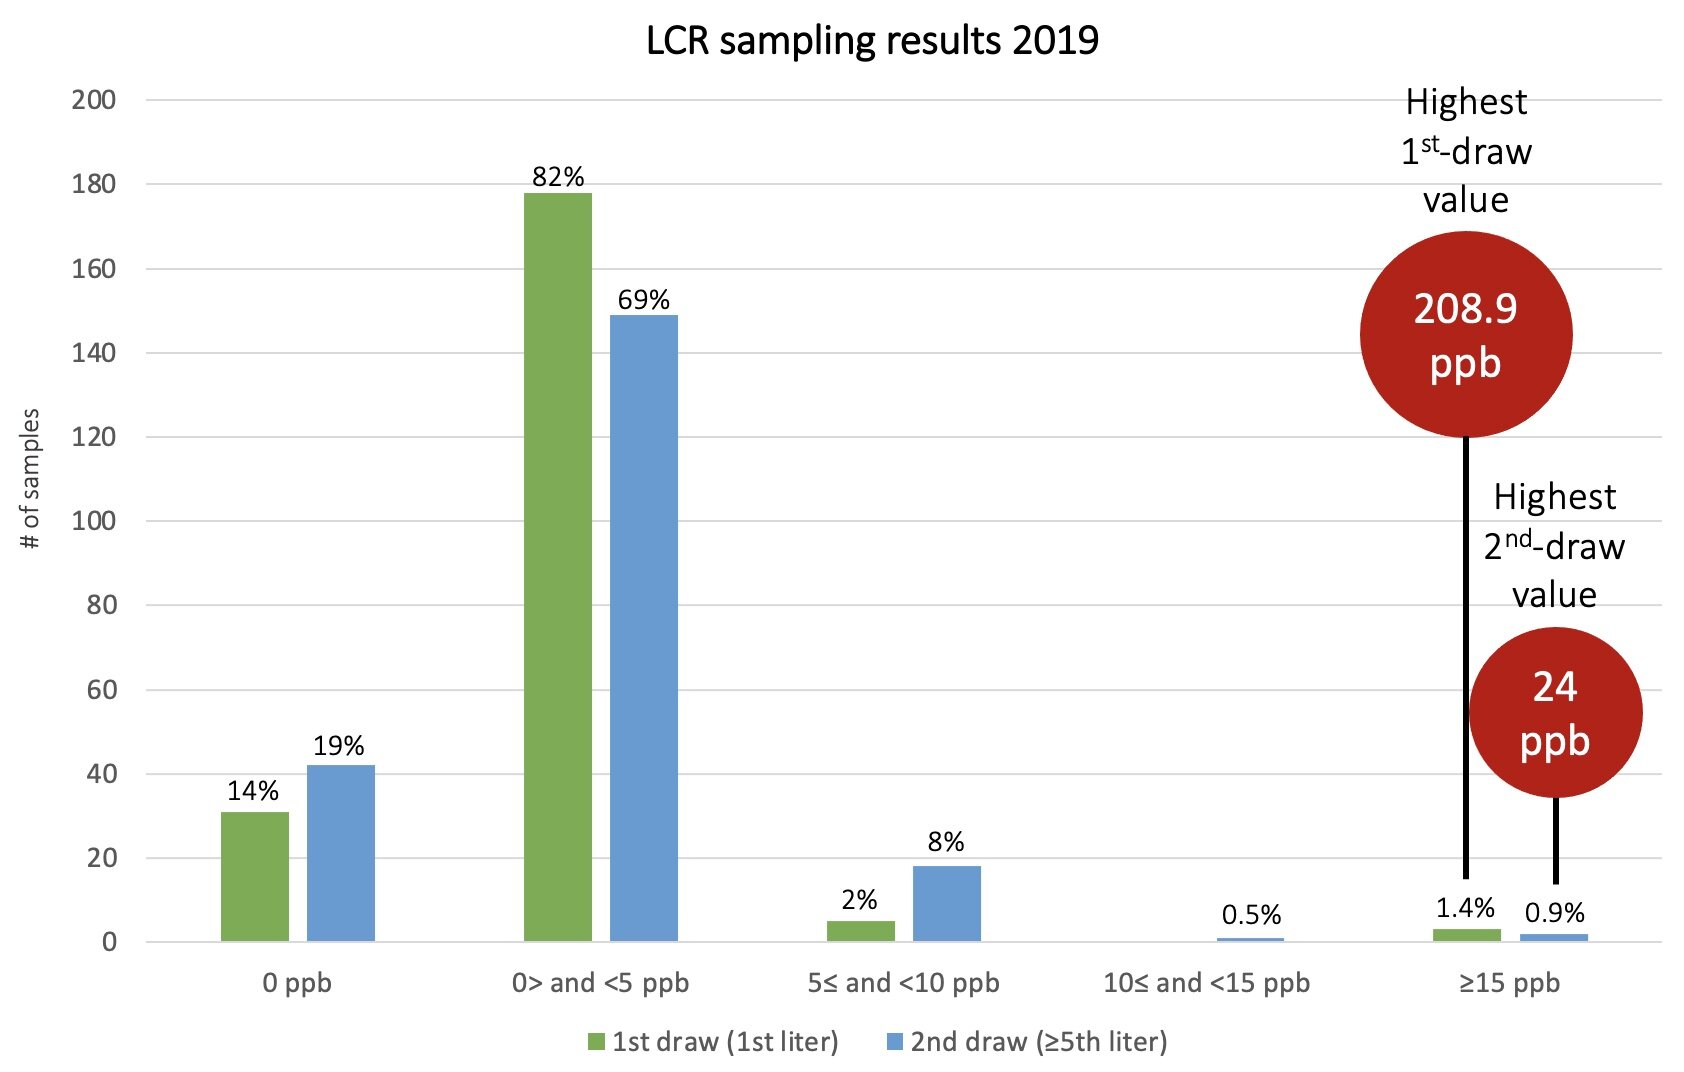
Graph 3: Organized differently, the same data set of lead-in-water measurements from Jan-Jun and Jul-Dec 2019 highlights that taps in the majority of sampled homes dispensed lead. Moreover, given the highest 1st- and 2nd-draw lead values, it is clear that some degree of contamination came in the form of lead particles. These are tiny pieces of pure lead, leaded solder, leaded brass, and lead-containing scale and sediment that tend to release erratically and unpredictably and that can contain very high concentrations of lead and result in acute lead exposures.
Considering that no level of lead exposure has been identified as safe for human health, this extent of contamination is alarming. Moreover, the testing methods used are not the best science has to offer, which means that DC Water’s lead-in-water monitoring program in 2019 and 2020 probably did not capture worst-case lead levels at the high-risk homes sampled. The water sampling instructions, although legal under the LCR, may have routinely missed water that sat in lead service lines during stagnation and that carried higher levels of lead to residents’ faucets. Similarly, most of DC Water’s sampling events took place in colder months of the year, when lead-in-water levels tend to drop. Finally, the dramatic variability in the release of lead from plumbing means that taps which tested low for lead during DC Water’s monitoring, may dispense high and extremely high levels of lead at other times.
Simply put, a quick look at DC Water’s lead-in-water data through a public health lens suggests that residents in many, if not most, DC homes continue to be at risk of exposure to lead through the city’s water.
The Campaign for Lead Free Water believes that claims of safety about the District’s water should no longer be based on optical illusions that leave residents falsely assured and unprotected. In a city like DC, which has experienced the nation’s most severe lead-in-water crisis to date, this is not only a public health imperative, but also a moral imperative.
If there is one message that we hope to deliver to EPA today, it is that we are in urgent need for an LCR that aligns regulatory compliance requirements with public health protective standards. Water utilities across the country should no longer work at cross-purposes with the communities they are required to protect.
In solidarity,
Yanna Lambrinidou, PhD
pnalternatives@yahoo.com
Paul Schwartz
paulschwartzdc@gmail.com
Acknowledgements: We would like to thank Valerie Baron, NRDC, for her invaluable input on this post.